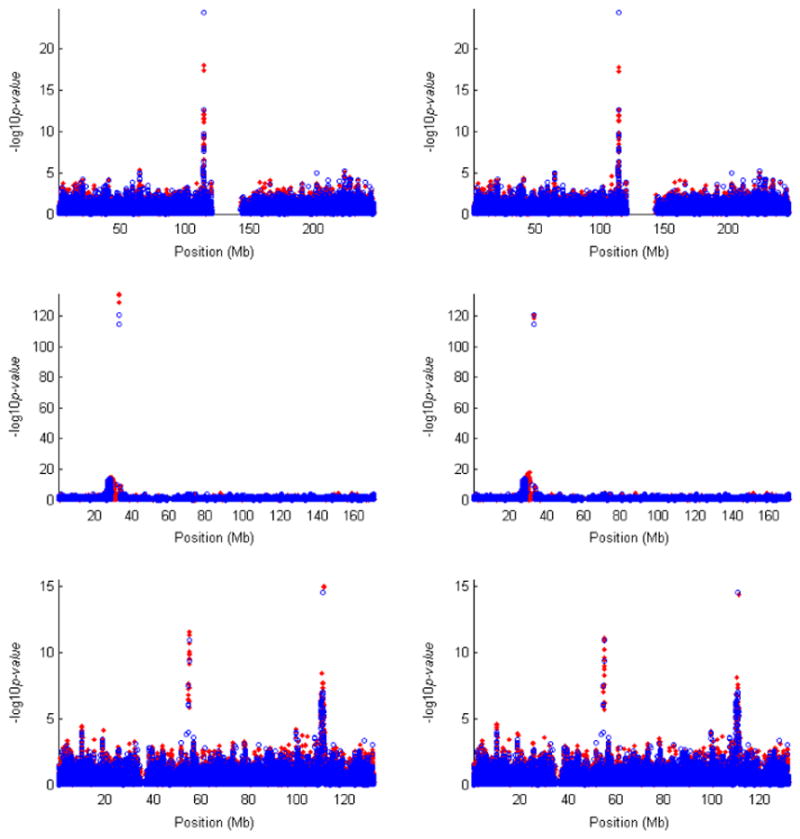
Fig. 6.

Results of single-SNP association tests for the WTCCC study of T1D. The log10 P-values for typed SNPs and untyped SNPs are shown in blue circles and red dots, respectively. The three rows correspond to chromosomes 1, 6 and 12, which have the strongest evidence of association. The left column corresponds to the trend test for the typed SNPs and the MLE method for the untyped SNPs. The right column corresponds to the trend test for the typed SNPs and the IMP-DOS method for the untyped SNPs. All typed SNPs pass the standard project filters, have MAF >1% and missing data rate <1%, and have good cluster plots. All untyped SNPs have MAF >1% in HapMap. WTCCC, Wellcome Trust Case-Control Consortium; SNP, single nucleotide polymorphism; T1D, type 1 diabetes; MLE, maximum-likelihood estimator.
