
Figure 2.
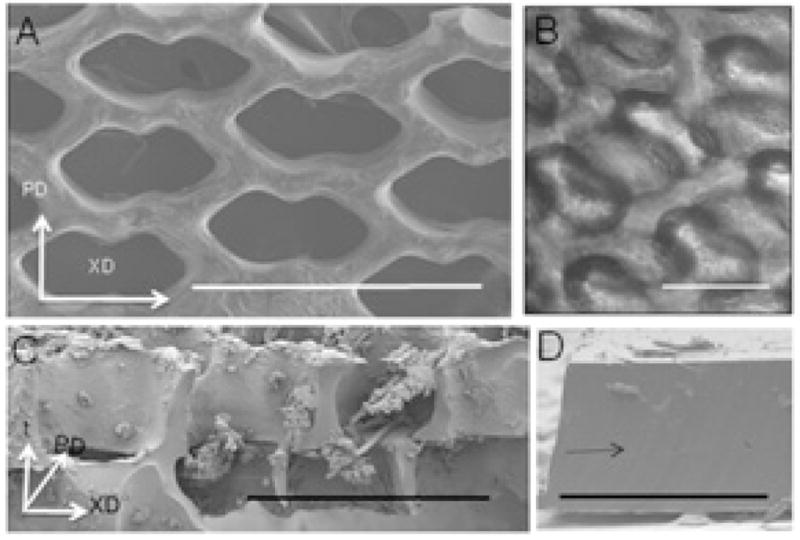
(A) One-layered scaffold, viewed from above by SEM, showing pore design. (B,C) Two-layered scaffolds seeded with cells, viewed either from above by phase contrast microscopy (B) and in cross-section by SEM (C), showing that the off-set pore structure allows cell penetration, and that cell separation from the polymer is not present by phase contrast microscopy but occurs during processing for SEM. (D) Two laminated PGS membranes showing tight bonding between layers following oxygen plasma treatment. Scaffold axes (A–C) are PD, XD, t. (D) Arrow points to region of PGS bonding. Scale bars: (A,C) 500 μm; (B) 200 μm; (D) 1 mm.