
Figure 4.
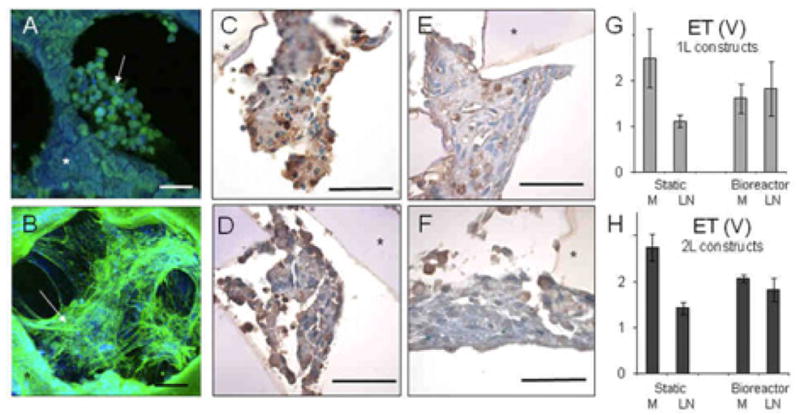
Effects of scale (1L or 2L), seeding method (M or LN), and culture method (static or bioreactor) on cell appearance and excitation threshold. (A,B) 1L constructs seeded using (A) M or (B) LN and cultured statically shown by confocal immunofluorescence microscopy after actin-phalloidin staining; arrows point to cells; asterisk indicates the scaffold. Scale bars: 50 μm. (C-F) 2L constructs based seeded using (C,D) M or (E,F) LN and cultured (C,E) statically or (D,F) with perfusion shown by light microscopy after histological sectioning and TUNEL staining; apoptotic cells appear brown; asterisk indicates the scaffold. Scale bars: 50 μm. (G,H) Excitation thresholds (ET) measured for (G) 1L and (H) 2L constructs seeded using M or LN and cultured statically or with perfusion showing significant interactive effects of seeding and culture methods (p=0.04 for 1L; p=0.013 for 2L). Data are the average ± SEM of n=4 one-layered and n=6 two-layered constructs.