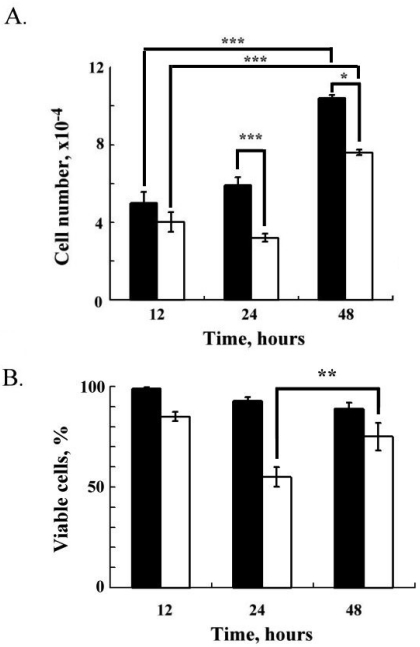
Fig 2.
Cell proliferation and viability of RL95-2 cells after Lcn-2 treatment. RL95-2 cells (2 × 10⁴ cells) were cultured for 36 h in complete medium and then cultured with or without 10 μM Lcn-2 for an additional 12, 24 and 48 h. (A) Cell numbers. (B) Relative percentages of viable cells after Lcn-2 treatment as compared with untreated control cells. The black bar indicates control cells; the blank bar indicates Lcn-2-treated cells. The data are given as the mean ± SEM. *, P < 0.05; **, P < 0.01; ***, P < 0.001 as compared with the control (n ≥ 4).

