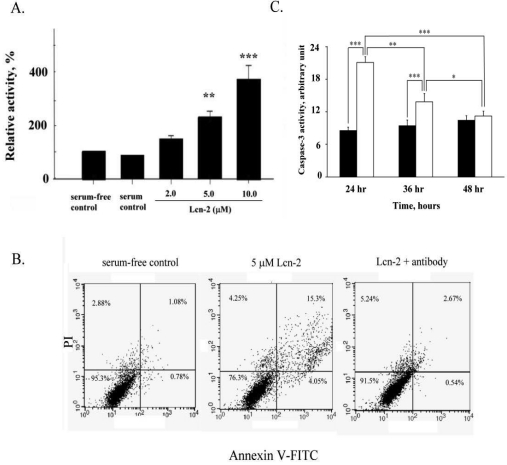
Fig 3.
Effects of Lcn-2 on caspase-3 activity in RL95-2 cells. RL95-2 cells were cultured in 48-well plates (2 × 10⁴ cells/well) with different amounts of Lcn-2 for 24 h and then incubated with 50 μl of caspase-3 substrate solution for 1 h at 37ºC. (A) The cleaved substrate has the following excitation and emission peaks: λex = 505 nm and λem = 530 nm. Cells were analyzed by flow cytometry. The data are expressed as the percentage of fluorescence intensity as compared with that of the control cells. (B) For cell apoptosis measurement, RL95-2 cells cultured for 24 h with 5 μM Lcn-2 in the absence or presence of 2.5 μM anti-Lcn-2. Cells were double stained with 2.0 μg/ml annexin V-FITC and 1.0 μg/ml PI for 10 min and analyzed by flow cytometry. (C) Cells were cultured as above with 10 μM Lcn-2 for 24, 36 and 48 h, and then caspase-3 relative activity were measured. The black bar indicates control cells, and the blank bar indicates Lcn-2-treated cells. Data are expressed as the percentage of fluorescence intensity as compared with that of control cells and are presented as the mean ± SEM of multiple experiments (n ≥ 4). ***, P < 0.001.

