Figure 1.
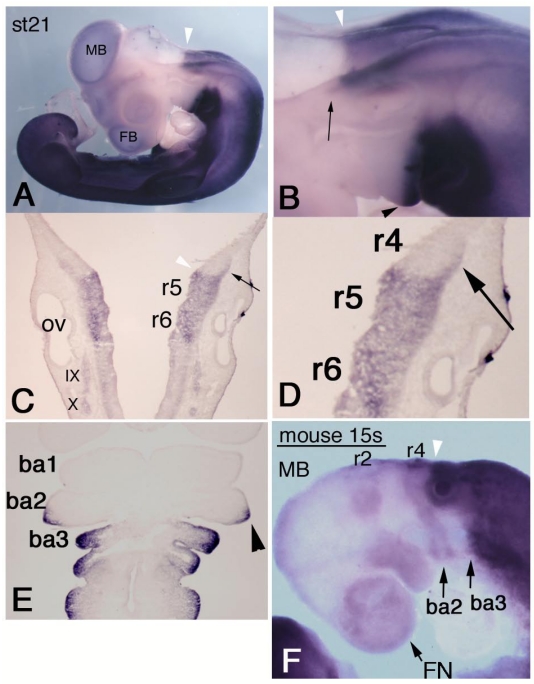
Expression pattern of chicken HOXA3 and mouse Hoxa3 in the anterior head region. In situ hybridization for HOXA3 mRNA in a st-21 embryo (A-E). (A) Lateral view shows weak signals in midbrain (MB) and forebrain (FB). The white arrowhead shows the salient boundary at r4/5 in the hindbrain. (B,C,D) Black arrows indicate expression area at the lateral edge of r4. HOXA3 expression is also observed in the posterior half of the second branchial arch (B,E, black arrowhead). (E) A frontal section of a st-21 embryo through the branchial arches. HOXA3 expression is seen in the posterior half of the second branchial arch (arrowhead). ba1,2,3: branchial arches 1,2,3. (F) In this 15-somite-stage mouse embryo, weak in situ hybridization signals are detectable in neural crest cells from the midbrain (MB), r2, and r4 to the frontnasal region (FN) and branchial arches 2 (ba2) and 3 (ba3). The white arrowheads (B,C,F) indicate the r4/5 boundaries. Strong signals are seen in the neural tube posterior to the r4/5 boundary and in mesenchymal cells of branchial arch 3 and the more posterior region.

