
Figure 2.
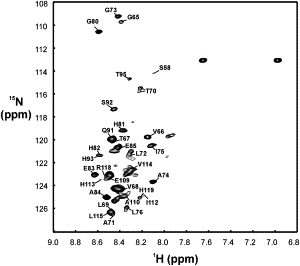
1H,15N-HSQC spectrum of 15N,13C-labeled apoMb119 (100 μM), in 20 mM sodium acetate, 5 mM KCl, and 5% D2O, at pH 6.0. The known spectral assignments (69) are indicated on the side of the respective resonances. In addition, the H64, K98, I111, H116, and S117 resonances were also assigned but are not labeled on the spectrum due to their low intensity.