
Figure 3.
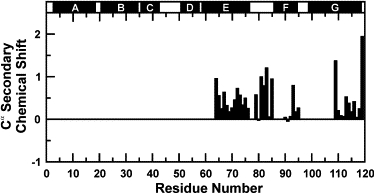
Cα NMR secondary chemical shifts for the detectable resonance of the apoMb119 soluble aggregate. Positive deviations from random coil values indicate α-helical secondary structure. (Solid bars above the plot) Sequence regions corresponding to native α-helices in full-length apoMb.