
Figure 1.
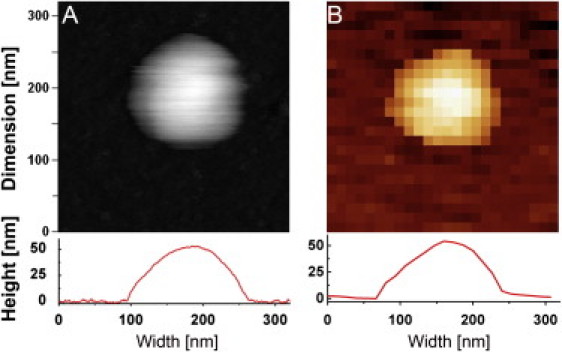
AFM imaging and stiffness measurements on small unilamellar vesicles. (A) A tapping mode height image of a liposome in buffer (320 × 320 nm scan size, 256 × 256 pixels). (Inset below) Cross-section height profile of the liposome. (B) A reconstructed height image from a force map of the same liposome (320 × 320 nm scan size, 24 × 24 pixels). Each pixel contains one FZ curve from which the height and stiffness at that point can be measured. (Inset below) Cross-sectional height profile from the force map shows the same height as in tapping mode.