
Figure 2.
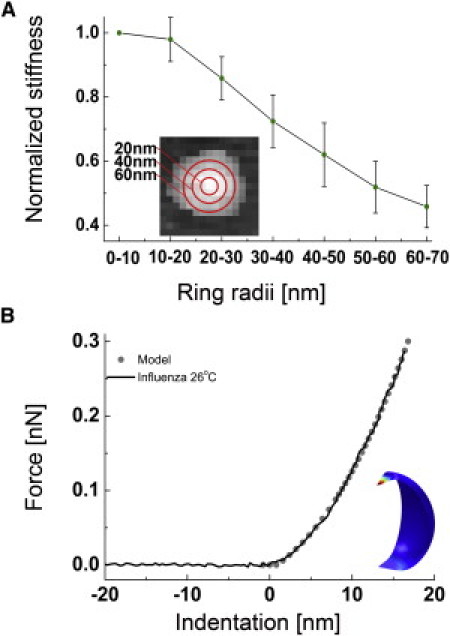
Dependency of the influenza liposome stiffness on the probed region. (A) The liposome was divided in concentric areas for which the average stiffness was measured (e.g., the pixels enclosed by the circles of 30-and 40-nm radius). The plot shows the normalized stiffness for 15 liposomes, the stiffness decreases when the liposome is probed further away from its center. (B) Averaged force versus indentation curve of a 71-nm-high influenza liposome, obtained by averaging four curves obtained within 20 nm from the center. The stiffness was obtained by performing a linear fit between 0.1 and 0.2 nN. (Shaded dots) Response calculated with FEM (d = 70 nm, E = 30 MPa). (Inset) Deformation of the thin-shell model by a hyperbolic tip and a flat surface.