
Figure 6.
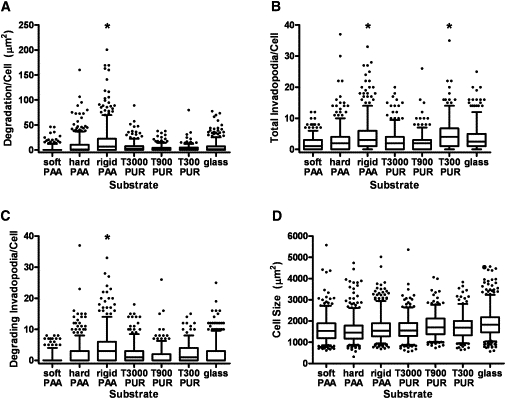
Quantitation of invadopodia numbers and activity on synthetic substrates. (A) Degradation area/cell peaked statistically on the rigid PAA substrates (i.e., significantly different from all other substrates) with a median value of 6.68 μm2. (B) Number of total invadopodia/cell (actively degrading and nondegrading) peaked statistically on both the rigid PAA (30 kPa) and T300 PUR (2 GPa) substrates with respective median values of 3 and 4. (C) The number of invadopodia actively degrading ECM/cell (as identified by colocalization of actin and cortactin over black areas only) peaked statistically only on the rigid PAA substrates with a median value of 3. (D) Differences in cell size were significant between some substrates but not between the majority of comparisons (except for glass, which was significantly different from all other substrates except T900 PUR; significances not shown on graph). Data are presented as box and whisker plots with solid lines indicating medians, whiskers representing 95% confidence intervals, and dots representing outliers. For comparisons depicted on the graphs, ∗ indicates p < 0.05 as described above for specific comparisons. For all statistical comparisons between groups, refer to Table S1. n ∼ 300–500 cells for each substrate, from four to six independent experiments.