
Fig. 3.
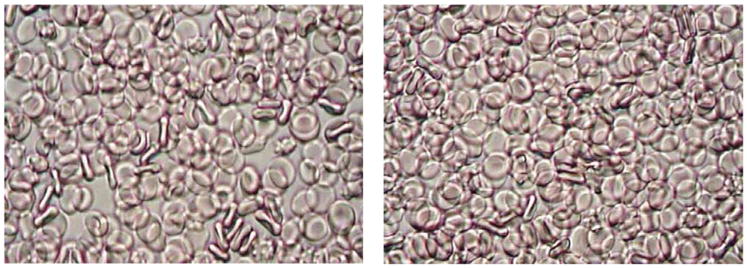
Suspensions of RBC in PBS with 1% albumin and with 20 ppm PEO (0.02 ml of PEO solution with a concentration of 1000 ppm per 1 ml of RBC suspension, right). Saline (0.02 ml per 1 ml of RBC suspension) was added to control suspension (left). Pictures (400× magnification) were taken using a light microscope (Nikon, Japan).