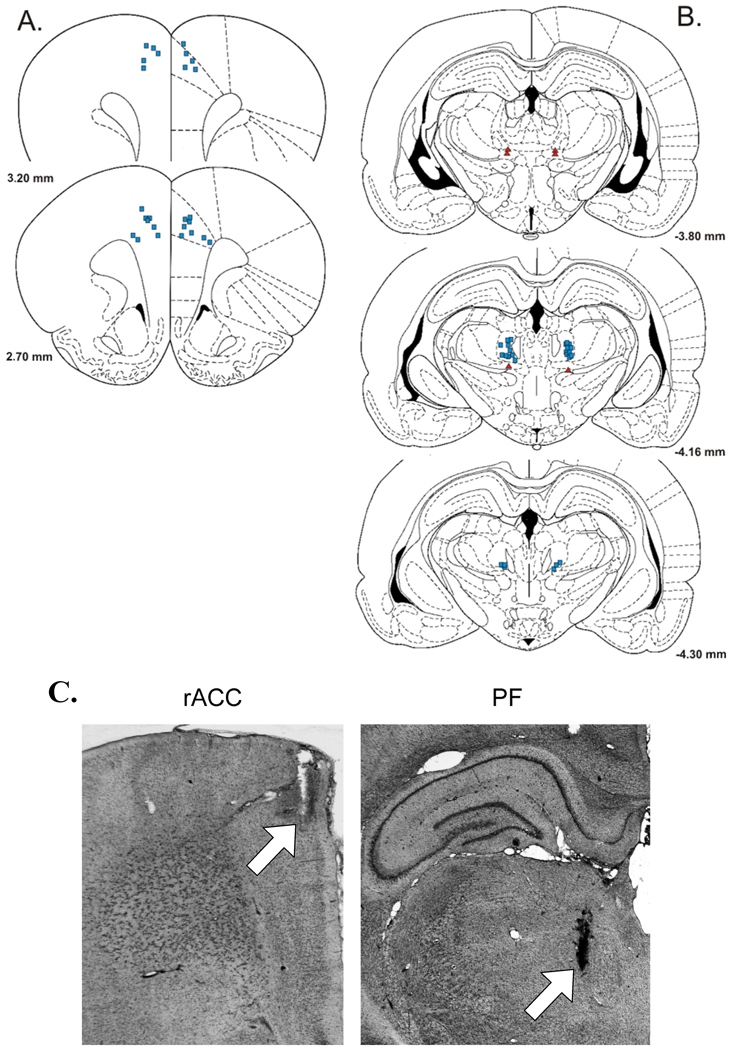
Figure 6.
Selected injection sites in and around (A) rostral anterior cingulate cortex (rACC) and (B) parafascicular nucleus (PF). Blue squares = carbachol injection sites in PF that were effective in elevating response thresholds, and corresponding injection sites of AP-5 and CNQX in rACC that failed to reduce increases in response thresholds produced by PF-carbachol treatment. Red triangles = injections of carbachol into areas outside the boundaries of PF (extra-PF). Coordinates are in millimeters from bregma. Schematics were derived from the rat brain atlas of Paxinos and Watson (1998). (C) Photomicrographs of representative microinjections (arrows) into rACC and PF. Both sites received bilateral injections.

