
Figure 3. Fear experience in patient SM.
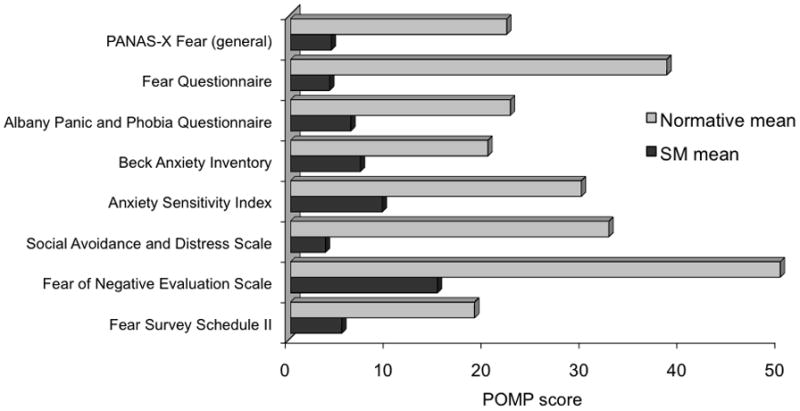
Self-report questionnaires comparing patient SM’s experience of fear to normative samples comprised of healthy individuals. All scores have been converted to POMP units [42] representing the “percent of maximum possible” for each questionnaire. Raw scores and additional information about the questionnaires can be found in Table S1. Data from the experience-sampling study can be found in Figure S3.