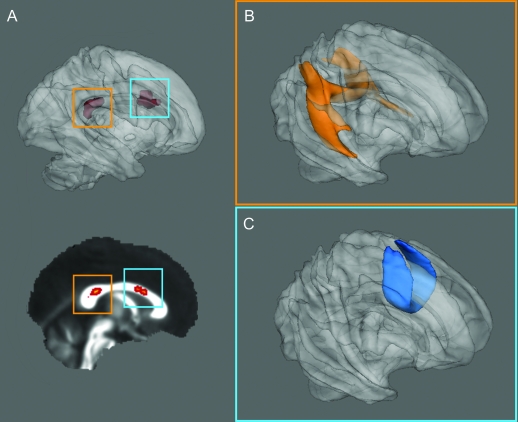
Figure 3. Probabilistic tractography of the anterior and posterior regions of change.
Probabilistic tractography group maps (healthy controls and patients with juvenile myoclonic epilepsy) seeded from posterior (A, orange box) and anterior (B, blue box) corpus callosal regions identified in tract-based spatial statistics analysis. (B) Connectivity from the posterior callosal region; projections include the temporo-parietal projections of the cingulum and splenial fibers. (C) Group average connectivity to anterior superior frontal regions from the anterior callosum.

