
Figure 5.
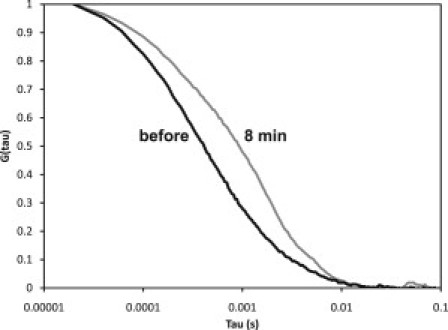
Normalized autocorrelation function of 100 nM EGFP-endophilin in 75 mM NaCl buffer in the absence of dynamin 2 (black line) and 8 min after the addition of 1 μM dynamin 2 (gray line). The autocorrelation functions were each fit to a single diffusion constant, with the 100 nM EGFP-endophilin giving a value of 39 μm2/s and, after 8 min, 14 μm2/s. Attempts to fit the latter data to multiple diffusion constants resulted in convergence back to a single diffusion constant (data fits not shown).