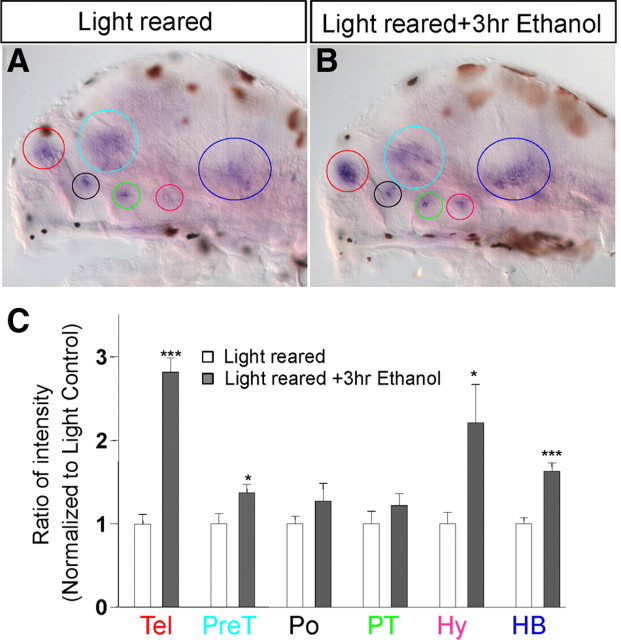
Figure 8.
Ethanol treatment causes an increase in crf expression. A, B, Expression of crf in control light-reared and mock-treated larvae (A) and light-reared larvae treated with 1.5% (257 mm) ethanol for 3 h (B). Note that the light brown spots on the images are melanocytes containing melanin. C, Quantification of ratio of intensity normalized to light-reared and mock-treated controls shows an increased expression in the telencephalon (Tel; red), pretectum (light blue), hypothalamus (pink), and hindbrain (dark blue; colors also refer to circles in A, B). ***p < 0.001, *p < 0.05, n = 10, Student's t test applied to individual clusters.

