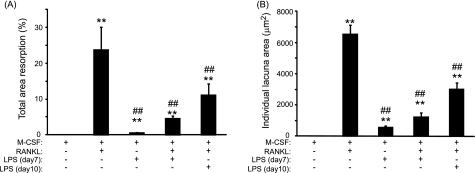
FIGURE 2.
LPS-induced bone resorption is lower than sRANKL-induced bone resorption. Total area resorption (A) and individual lacuna area (B) in M-CSF-, M-CSF/LPS-, M-CSF/sRANKL-, M-CSF/sRANKL/LPS (day7)-, and M-CSF/sRANKL/LPS (day10)-treated cultures. **, p < 0.01 compared with M-CSF alone; ##, p < 0.01 compared with M-CSF/sRANKL-treated cultures. Error bars = S.E.

