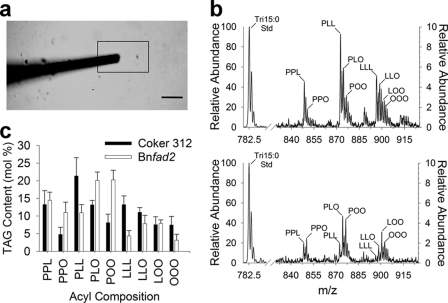
FIGURE 5.
Single lipid droplet mass spectrometry and lipid droplet heterogeneity. a, bright field snapshot image of a nanospray emitter directly sampling a single LD as demonstrated in supplemental Movie 2. Scale bar represents 5 μm. b, representative TAG profiles with acyl chain designations of single LD from Tables 1 and 2 (Coker 312 LD6 and Bnfad2 LD6. LD-TAG peaks are attenuated according to the right axis to show resolution of peaks relative to spiked Tri15:0 TAG standard represented by the left axis. c, heterogeneity of TAG content within single seed LDs (n = 7 for both Coker 312 and Bnfad2). Numerical values are in Tables 1 and 2. P, 16:0-palmitic acid; O, 18:1-oleic acid; L, 18:2-linoleic acid.

