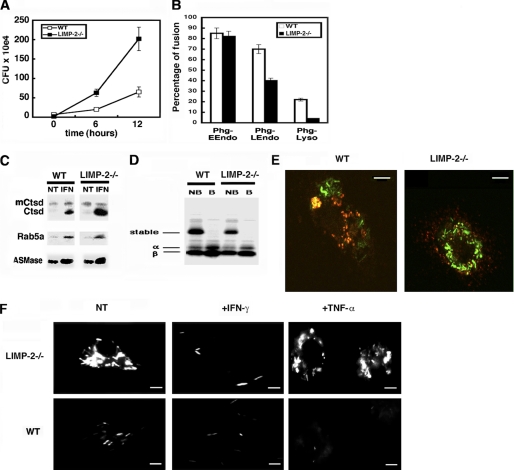
FIGURE 2.
The activation of LIMP-2−/− BM-DM was impaired, and they failed to control cytosolic LM growth. A, BM-DM from WT or LIMP-2−/− littermates were infected with LM for 0, 6, or 12 h. The results are expressed as CFU × 104 ± S.D. of triplicate samples (“Experimental Procedures”). B, BM-DM were incubated with streptavidin-HRP to label early endosomes, late endosomes, or lysosomes and next infected with biotinylated LM to isolate phagosomes according to the protocol described under “Experimental Procedures.” The HRP enzymatic activity was measured by the absorbance at A450 nm. The results are expressed as the percentages of total internalized HRP activity and reflect the percentage of fusion of phagosomes with either early, late endosomes or lysosomes. C, LM phagosomes from BM-DM pretreated with mIFN-γ before infection (IFN lanes) or nontreated (NT lanes) were isolated as described under “Experimental Procedures,” and 30 μg of phagosomal proteins were loaded per lane. Western blots indicate the inactive and membrane-bound Ctsd forms (mCtsd) and the active and soluble Ctsd bands (Ctsd), developed with a rabbit anti-Ctsd antibody. The Rab5a bands were developed with a mouse monoclonal anti-Rab5a antibody and the ASMase bands with a goat anti-mouse ASMase antibody. D, LM phagosomes from BM-DM labeled with 10 μCi of 35S-translabel, as in Fig. 4C, were isolated as under “Experimental Procedures,” and 30 μg of phagosomal proteins were boiled (B lanes) or nonboiled (NB lanes) before loading. The labels show stable αβ dimers and unstable α and β chains as reported (32, 33). E, WT or LIMP-2−/− BM-DM were infected with GFP-LM for 1 h, and MIIC compartments were labeled with biotinylated anti-IAb antibody followed by streptavidin-phycoerythrin. Co-localization images appearing as yellow fluorescence were analyzed by confocal microscopy. The scale bars correspond with 5 μm. F, different BM-DM pretreated with IFN-γ (+IFN-γ samples), TNF-α (+TNF-α samples), or untreated (NT samples) were infected with GFP-LM (ratio 10:1, bacteria:cell) for 12 h, and fluorescent images were analyzed by conventional fluorescent microscopy. The scale bars correspond with 6 μm. CFU values at 12 h were 10 × 104 (WT and untreated images), 2 × 10² (WT and +IFN-γ images), 3 × 10² (WT and +TNF-α images), 65 × 104 (LIMP-2−/− and untreated images), 13 × 102 (LIMP-2−/− and +IFN-γ images), and 56 × 104 (LIMP-2−/− and TNF-α images).

