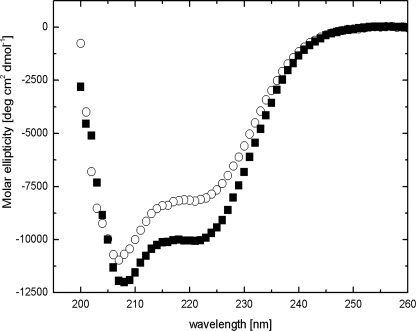
FIGURE 6.
Conformation of NpSCS changes upon Ca2+ binding. CD spectra of 2 μm AtSCS solution in 5 mm Tris, pH 7.4, with 100 mm NaCl with or without calcium ions are shown. ■, plus 0.1 mm Ca2+ (enough for saturation of Ca2+ binding loop as inferred from fluorescence measurements; Fig. 5A). ○, plus 0.1 mm EDTA.

