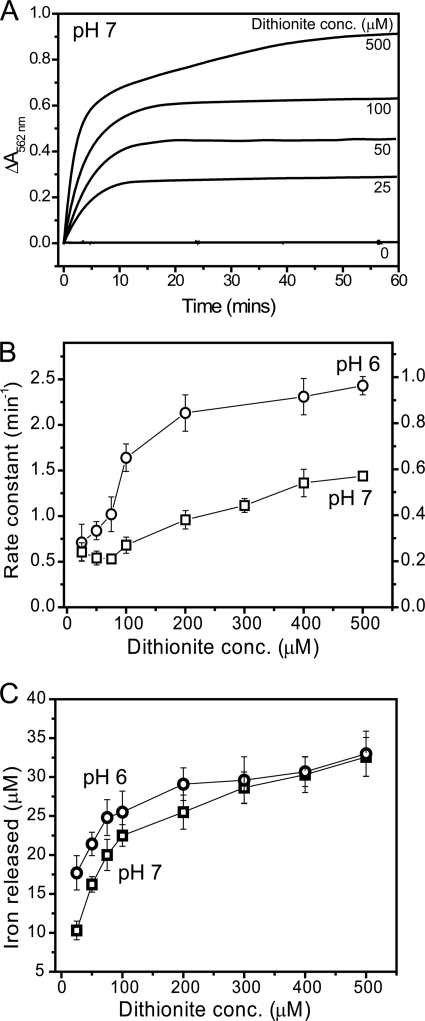
FIGURE 1.
Iron release from E. coli BFR followed by a dithionite-ferrozine assay. A, plots of ΔA562 nm as a function of time following the addition of varying concentrations (as indicated) of sodium dithionite to BFR (0.05 μm) containing ∼1200 irons/protein in MBS, 1 mm ferrozine, pH 7, at 25 °C. B, apparent rate constants, obtained from fitting the release data in A (and from similar experiments) as described under “Experimental Procedures,” plotted as a function of dithionite concentration. The left ordinate corresponds to data at pH 6 (see supplemental Fig. S2), and the right ordinate corresponds to data at pH 7. C, plots of the concentration of iron detected as the [Fe(II)(ferrozine)3]4− complex at the end point of each release reaction as a function of dithionite concentration. Data in B and C and in other figures are presented as averages (n ≥ 3) ± S.D. (error bars).

