FIGURE 6.
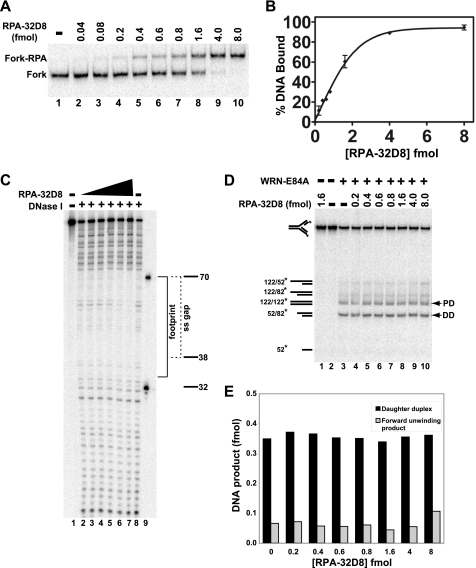
Effect of phosphomimetic RPA-32D8 on WRN-E84A-mediated fork regression. A, RPA-32D8 (0.04–8.0 fmol) was incubated with the fork substrate (1 fmol) for 10 min at 25 °C, and DNA binding of RPA-32D8 was analyzed by EMSA as described. The positions of the RPA-32D8-fork complexes and the fork substrate are indicated at the left. B, for experiments as presented in A, the amount of fork substrate bound was determined by comparing the amount of bound DNA to the total DNA for each reaction and plotted versus RPA-32D8 concentration. Each data point is the average of two independent experiments. C, binding of RPA-32D8 (1.0–32 fmol) to the fork substrate (5 fmol) is analyzed by DNase I footprinting as described under “Experimental Procedures.” Position of the markers, the boundary of the leading arm gap (dashed bracket), and the area of protection by RPA-32D8 (solid bracket) is denoted on the right. D, in fork regression assays, shown is the fork substrate (1 fmol) with or without RPA-32D8 (0.2–8.0 fmol) for 5 min at 4 °C followed by the addition of WRN-E84A (3.5 fmol), except where indicated, and further incubation at 37 °C for 15 min. The position of individual DNA species is noted on the left and for parental (PD) and daughter duplexes (DD) by arrowheads also on the right. E, for WRN-mediated fork regression reactions as depicted in D, amounts of daughter duplexes and products of forward unwinding were quantitated as described, and the data are plotted as a bar graph showing the amounts of these products with respect to RPA-32D8 concentration.

