FIGURE 2.
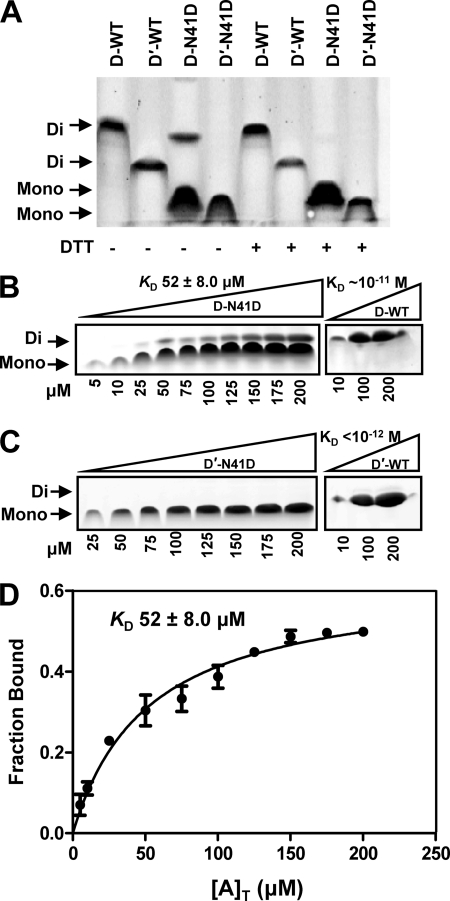
UmuD N41D and UmuD′ N41D are monomers. A, a native gel shows the resolution of UmuD and UmuD′ monomers (Mono) and dimers (Di) at 10 μm. The plus (+) sign indicates the addition of DTT to the sample. B, a representative native gel shows monomer and dimer formation as a function of increasing concentrations of UmuD N41D (5, 10, 25, 50, 75, 100, 125, 150, 175, 200 μm as indicated below the gel) as well as wild-type UmuD2 (10, 100, 200 μm). C, a representative native gel shows monomer and dimer formation as a function of increasing concentrations of UmuD′ N41D (25, 50, 75, 100, 125, 150, 175, 200 μm as indicated below the gel) as well as wild-type UmuD′2 (10, 100, 200 μm). D, shown are calculated dimer concentrations (fraction bound) as a function of total concentration of UmuD N41D ([A]T). Dimer concentrations were obtained as a function of total concentration of UmuD N41D to give a KD of 52 ± 8.0 μm (S.E.) (solid line).

