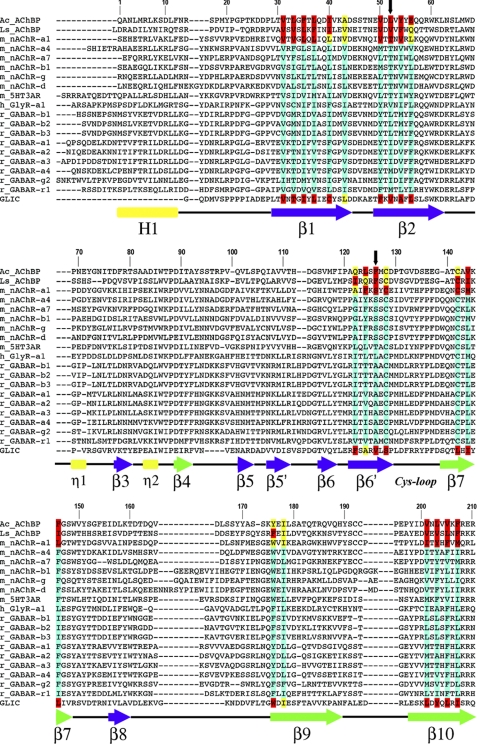
FIGURE 1.
Sequence alignment of AChBPs and representative pLGIC ECDs. The core residues, in crystal structures, with accessible surface area (ASA) ≤5 and ≤25% are highlighted in red and yellow, respectively. Based on sequence alignments, putative core residues in other pLGICs are highlighted in turquoise. Black downward arrows mark the positions of core residues aligned with nAChR-α1 Thr-52 (site 1) and Ser-126 (site 2). Amino acid numbering refers to the mouse nAChR-α1 sequence. Secondary structure elements are indicated below the sequences and are labeled in Greek letters based on the crystal structure of nAChR-α1 ECD (26). β-Strands are blue (inner sheet) or green (outer sheet) arrows, helices are rectangles (the N-terminal α-helix is labeled in uppercase, the 310-helices in lowercase), and connecting loops are black lines.

