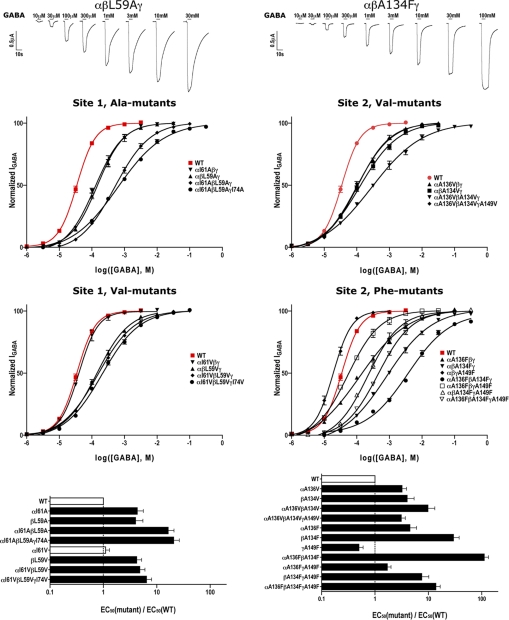
FIGURE 4.
Altering the β-core packing at sites 1 (left panels) and 2 (right panels) affects GABA activation of GABAARs. Representative GABA activated current traces (top), GABA dose-response curves (middle), and plots of EC50mutant/EC50WT ratios (bottom) are shown. Wild-type (WT) α1β2γ2 GABAAR dose-response curves are shown in red (EC50 = 34.59 ± 4.02 μm, n = 5). Black bars in bottom panels indicate values significantly different from WT (p < 0.01). EC50 values and Hill coefficients are reported in Table 1. At site 1, replacing the bulky hydrophobic (leucine/isoleucine) in GABAAR subunits with smaller residues (alanine and valine) right-shifted the GABA dose-response curves. At site 2, replacing the conserved alanine, which likely creates a cavity in the hydrophobic β-core, with larger residues (valine and phenylalanine) also significantly right-shifted the GABA dose-response curves.

