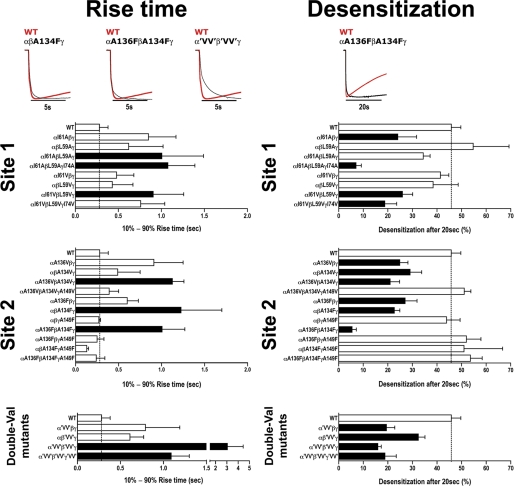
FIGURE 7.
Altering packing at sites 1 and 2 slows GABA current rise time and desensitization. Representative saturating GABA current traces from oocytes expressing WT and mutant GABAARs are peak normalized to highlight the slowing in GABA 10–90% rise times (left) and current desensitization (right) for mutant receptors. Values are reported in Table 3. Bars represent mean ± S.E. of 10–90% rise times (s) and percent current desensitization after 20 s (((Imax − I20 sec)/Imax) × 100) from WT and mutant receptors (n > 3 individual experiments). Black bars indicate values significantly different from WT (p < 0.05).

