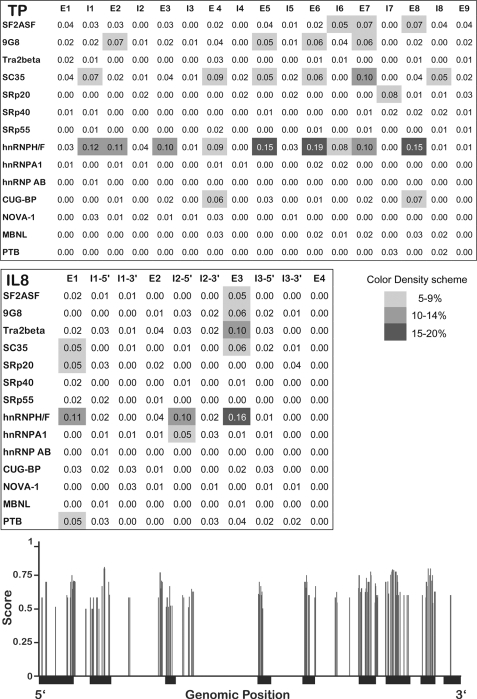
FIGURE 2.
Normalized frequency of predicted splicing factor binding sites, mapped along the intronic and exonic regions of the TP and IL8 genes. Upper and middle panels, binding sites for various splicing factors were predicted using our in-house algorithm SFmap (17). Gray-shaded areas represent the normalized frequency of predicted binding sites within each region; white to dark gray denote low to high densities of binding sites, respectively (color bar shown). The names of the splicing factors appear on the left side of each section, and the position within the genes is indicated by E (exon) and I (intron). Lower panel, localization and mapping of predicted hnRNP F/H-binding sites throughout the human TP gene. The structure of the TP gene is represented on the x axis, in which thin and thick black lines denote introns and exons, respectively. Vertical gray bars indicate the location of significant hits for hnRNP F/H2-binding sites along the gene. The binding sites were predicted using SFmap (17); the height of the bars indicates the prediction score (ranging from 0 to 1).

