FIGURE 4.
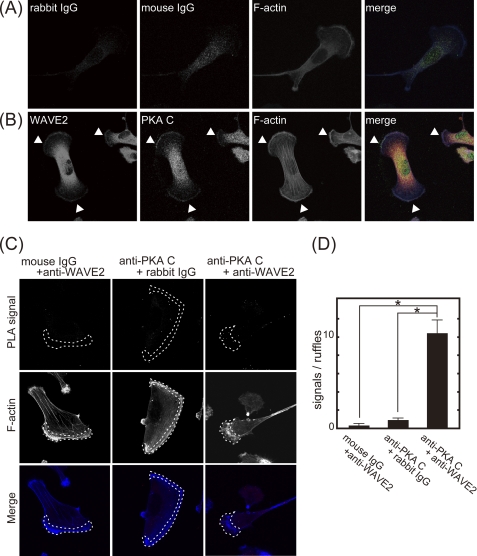
PKA colocalizes with WAVE2 at the leading edge of membrane protrusions. MDA-MB-231 cells were seeded on coverslips coated with type I collagen (6 μg/ml). A and B, cells were immunostained with control rabbit IgG (red), mouse IgG (green), and phalloidin (blue) (A) or with anti-WAVE2 antibody (red), anti-PKA C subunit antibody (green), and phalloidin (blue) (B). Arrowheads indicate WAVE2 and PKA colocalization at membrane protrusions. Note that signals detected by anti-WAVE2 antibody in the central region of the cell are nonspecific because pre-adsorption of anti-WAVE2 antibody with purified GST-WAVE2 removed the signal in peripheral region but not in the central region (supplemental Fig. 2). C, cells were subjected to the PLA using control IgG or anti-WAVE2 and anti-PKA C subunit antibodies. PLA signals and phalloidin staining are shown in the upper and middle panels, respectively. Merged images are shown in the lower panels (PLA signal, red; and F-actin, blue). Phalloidin-positive protrusions are indicated by dashed lines (middle panels). The central region of the cells also showed some PLA signals even with control IgG, suggesting that signals in the central region may be nonspecific signals. D, shown is the quantification of PLA signals. PLA signals localized at phalloidin-positive protrusions were counted.

