FIGURE 1.
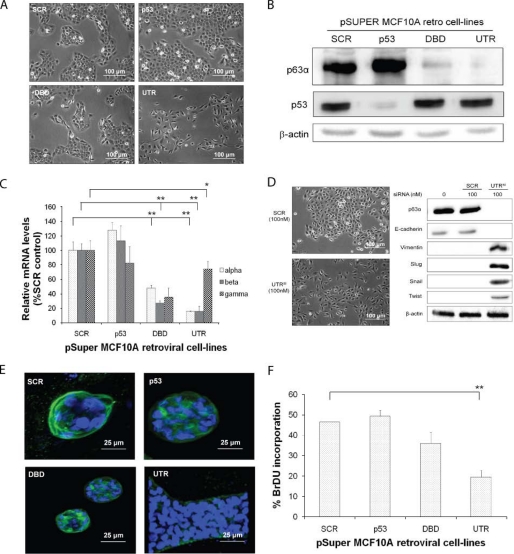
Knockdown of p63α and β isoforms results in a change of epithelial phenotype MCF10A retroviral cell lines. A, phase-contrast images of the control (SCR), p53-depleted (p53), all p63 isoforms depleted (DBD), and p63α and β isoform-depleted (UTR), showing EMT change in cells with UTR shRNA. B, p63 and p53 protein levels determined by Western blotting (β-actin detected using the mouse anti-actin antibody). C, qRT-PCR analysis of the p63α, β, and γ isoform mRNA expression levels. D, phase-contrast images of MCF10A cells, with knockdown of p63α and β isoforms, using a siRNA targeting a different sequence to the UTR (UTRsi) from that shown in A and B (β-actin detected using the mouse anti-actin antibody). E, confocal microscopy images of MCF10A retroviral cell lines. Blue DAPI nuclear staining and green Alexa Fluor 488 for laminin staining are shown. F, BrDU incorporation of MCF10A retroviral transduced cell lines, showing reduced proliferation of cells with DBD and UTR shRNA. All experiments were carried out in triplicate, and three independent studies were performed. Paired t tests were performed (Fig. 1, C and E), and significant differences with respect to the control, SCR, are shown (*, p < 0.05; **, p < 0.001).

