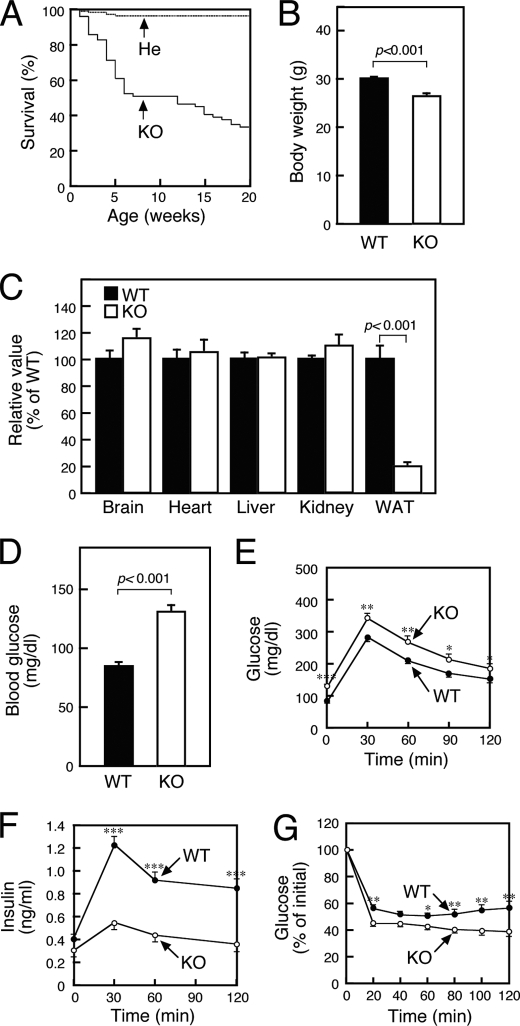
FIGURE 2.
SMS1-KO mice exhibit reduced insulin secretion. A, survival curve of SMS1-KO (KO, n = 68) and heterozygous (He, n = 153) mice. B, body weights of 10 weeks old wild-type (WT, n = 37) and SMS1-KO mice (KO, n = 9). C, weight of organs of 10-week-old mice (WT, n = 6; KO, n = 4). Mice of 12–16 weeks old were used for the following analysis. D, blood glucose levels after 16 h of fasting were measured using the glucose oxidase method (WT, n = 21; KO, n = 20). E, glucose tolerance tests. Mice were deprived of food for 16 h and injected with 1 mg/kg glucose. Blood was withdrawn at times indicated, and blood glucose was measured (WT, n = 21; KO, n = 24). F, amounts of insulin in the serum obtained from glucose tolerance tests performed in E were measured by an ELISA (WT, n = 32; KO, n = 25). G, insulin tolerance test. Mice were administered 1 unit/kg of human insulin. Blood was withdrawn at times indicated, and blood glucose was measured (WT, n = 21; KO, n = 20). *, p < 0.05; **, p < 0.01; ***, p < 0.001.

