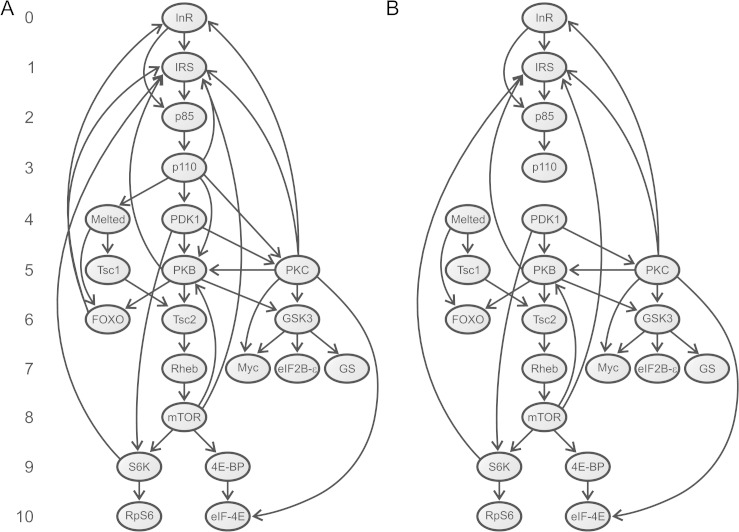
FIG. 1.
Directed graphs used in the network-level analyses. (A) Graph G containing all interactions (arcs) among human IT pathway proteins (nodes). This graph consists of 21 nodes and 39 arcs, of which 32 represent PPIs, five involve the membrane phospholipid PIP3 (synthesized by p110 isoforms and activates the IRS, Melted, PDK1, PKB, and PKC proteins), and the other two represent the activation of the INR and IRS2 genes by the FOXO transcription factors (Puig and Tjian 2005). Numbers on the left indicate the position of each component in the pathway. Human proteins having orthologs in Drosophila (Alvarez-Ponce et al. 2009) were assigned the same position as their Drosophila counterpart. We assigned position 5 to PKC proteins because they are activated by PDK1 (position 4) (LeRoith et al. 2004). We excluded the phosphoinositide phosphatase PTEN from network-level analysis because it does not directly interact with any other element in the graph (for review, see Vinciguerra and Foti 2006). The cytohesins Cyh1–4 were also excluded because their specific function in the pathway remains unclear (Hafner et al. 2006). (B) Graph S, subgraph of G containing only the 32 physical interactions. Both graphs were constructed using information gleaned from the literature.

