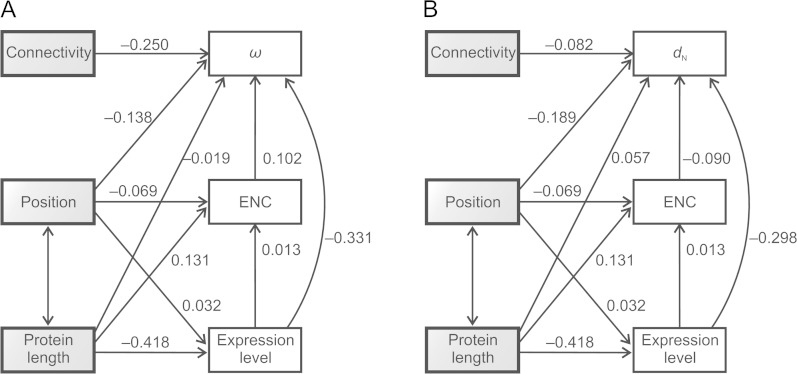
FIG. 3.
Path analysis for data set 2. Single- and double-headed arrows represent assumed causal dependencies and correlations, respectively. Numbers in each arrow represent the standardized path coefficients (β). None of the associations was significant. The analyses conducted using expression breadth instead of expression level yielded equivalent results. (A) Analysis for ω. (B) Analysis for dN.

