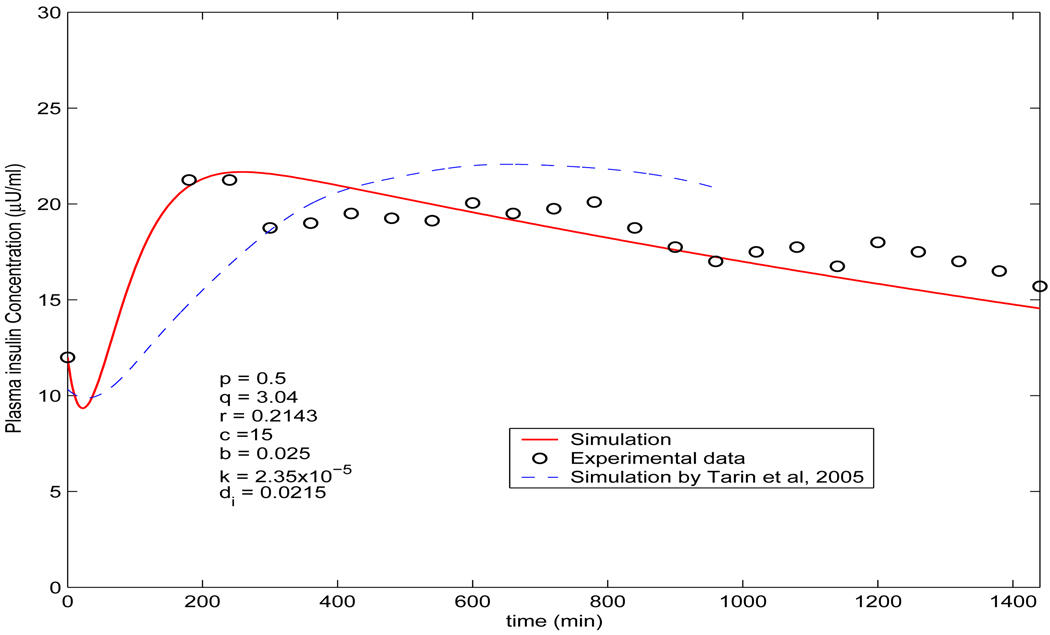
FIGURE 5.
Comparison of the simulated plasma insulin concentration (solid line) by model (3) (p = 0.5, q = 3.04, r = 0.2143, c = 15, b = 0.025, k = 2.35 × 10⁻⁵ and di = 0.0215) with the measured data from [18] (circle ○). The dashed line is the simulation by the model in [36], which is adapted from [36] showing from 0 hour to 16 hours.

