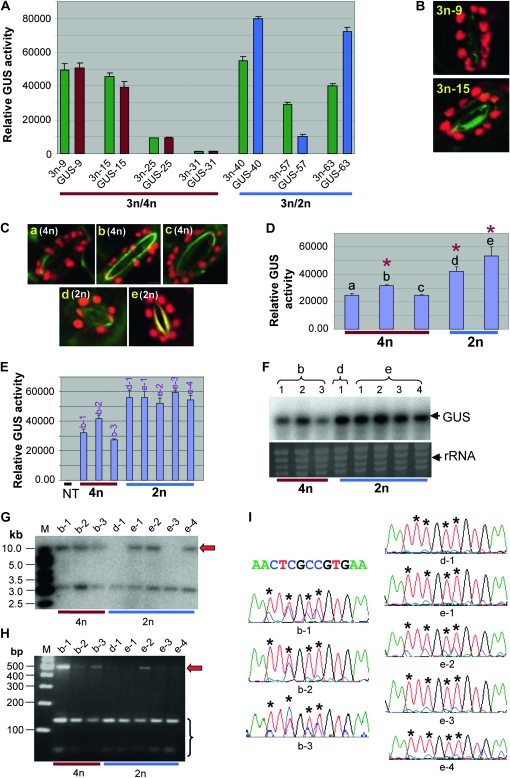
Figure 5.—
Expression and cytosine methylation analyses of 3n F1 GUS lines and the 2n and 4n progeny plants derived from the 3n line 3n-15. (A) Comparison of GUS expression between 3n plants and their parental 4n or 2n lines. These lines were heterozygous for the GUS transgene. Each pair of bars represents the mean value of GUS activity from three MUG assays of a parental 4n or 2n line (red or blue) and its 3n progeny (green). Error bars represent standard deviation. (B and C) Examples of visualization of chloroplasts in leaf guard cell confirming the 3n, 4n, or 2n ploidy level of the lines analyzed for GUS expression in A and D, respectively. (D) GUS expression analysis of 4n (a–c) and 2n (d and e) F3 progeny derived from the 3n F1 line 3n-15 in A. These F3 progeny plants were heterozygous for the GUS transgene. The asterisks indicate the three lines from which the F5 plants in E were derived. (E) GUS expression analysis of F5 lines derived from the F3 lines b, d, and e shown in D. These F5 lines were homozygous or near homozygous (see Table S2). NT, nontransgenic control. (F) Northern blot hybridization of GUS mRNA (upper) in the same F5 lines as shown in E, and ethidium bromide-stained rRNA as loading control (lower). (G) Southern blot hybridization analysis of the F5 lines. DNA was digested with HindIII and hybridized with Ocs3′. The red arrow indicates the high molecular weight band, suggesting partial resistance to HindIII digestion. M, GeneRuler 1 kb DNA marker. (H) MseI digestion of bisulphite PCR product for the F5 lines. M, GeneRuler 100 bp DNA marker. The red arrow indicates undigested PCR product, suggesting cytosine methylation. (I) Part of the sequencing trace files for the bisulphite PCR products of the F5 lines. As in Figure 4C, the four different nucleotides, A, T, C, and G, are shown in green, red, blue, and black, respectively. The red (T) and blue (C) mixed peaks indicate the presence of both bisulphite-converted and -unconverted cytosines. The original DNA sequence of the corresponding 13-bp region is given above. The asterisks indicate the position of cytosines.

