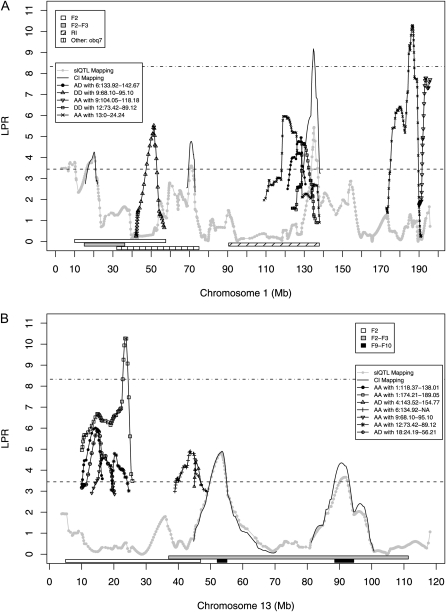
Figure 1.—
Mapping results of significant terms from the full model of reproductive fatpad weight in the LG,SM AI line for chromosomes 1 (A) and 13 (B). Results from the single-locus model are given as connected shaded dots, composite interval mapping as smooth solid lines, and epistatic interactions by other connected shapes. Confidence intervals from previous analyses are represented by horizontal bars below the QTL plot.

