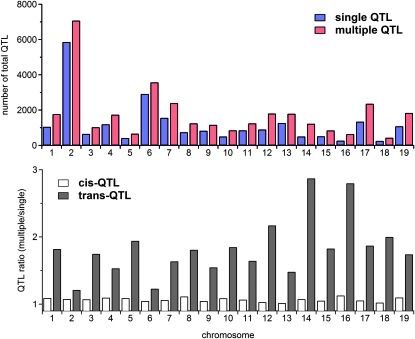
Figure 2.—
Top: The total number of QTL (cis-QTL + trans-QTL) identified by the single- and multiple-QTL mapping approaches. Bottom: Comparison between the number of cis-QTL identified by the multiple-QTL mapping approach and that identified using single-QTL mapping (open bars), and similarly for trans-QTL (shaded bars).

