Figure 3.—
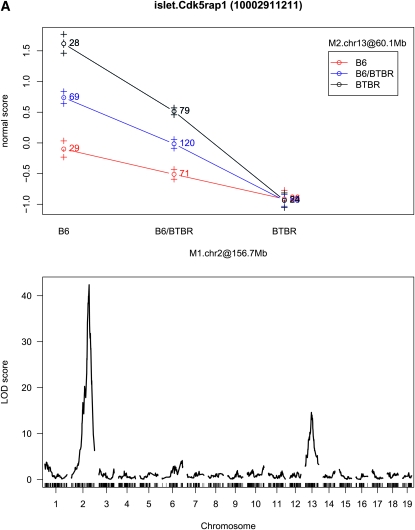
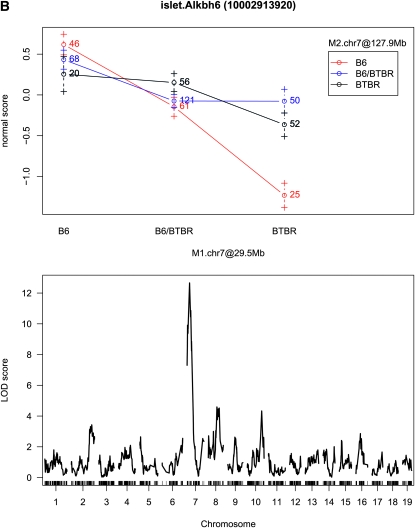
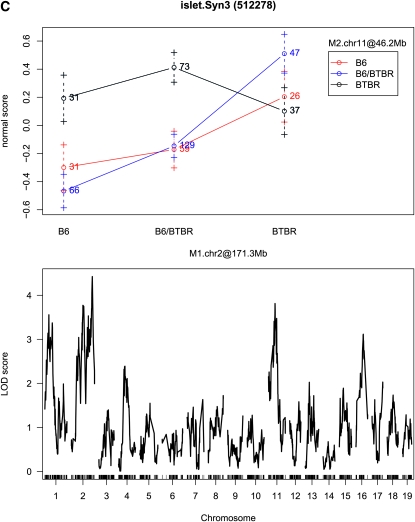
Interaction plots and single-QTL LOD profiles for three expression traits. The LOD score for Cdk5rap1 (A) at rs4223605 (M1.chr2 at 156.7 Mb) is 42.37 and at rs13481837 (M2.chr13 at 60.1 Mb) is 14.6; the LOD score for Alkbh6 (B) at rs4226520 (M1.chr7 at 29.5 Mb) is 12.66 and at rs13479518 (M2.chr7 at 127.9 Mb) is 0.64; and the LOD score for Syn3 (C) at rs13476918 (M1.chr2 at 171.3 Mb) is 4.43 and at rs6365385 (M2.chr11 at 46.2 Mb) is 3.81.


