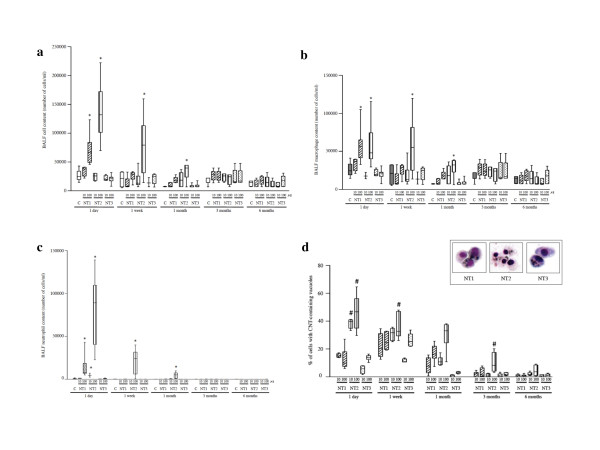
Figure 5.
Effects of MWCNT in vivo in mice - BALF analysis. Panel a: Effect of NT1, NT2 or NT3 in a dose of 10 or 100 μg/mouse on total cell content of bronchoalveolar lavage fluid (BALF) after 1 to 180 days' exposure. Results are represented as box and whisker plots of values from 4-6 animals per group. Abbreviations are the same as in Figures 1 and 2. *: p < 0.05 compared to control mice. Panel b: Effect of NT1, NT2, or NT3 (10 or 100 μg/mouse) on total BALF macrophage content after 1 to 180 days' exposure. Results are represented as box and whisker plots of values from 4-6 animals per group. Abbreviations are the same as in Figures 1 and 2. *: p < 0.05 compared to control mice. Panel c: Effect of NT1, NT2, or NT3 (10 or 100 μg/mouse) on total BAL fluid neutrophil content after 1 to 180 days' exposure. Results are represented as box and whisker plots of values from 4-6 animals per group. Abbreviations are the same as in Figures 1 and 2. *: p < 0.05 compared to control mice. Panel d: Quantification of BAL macrophages with internalized carbon nanotubes, expressed as the percentage of the total macrophage number. Results are represented as box and whisker plots of values obtained from 4-6 animals per group. #: p < 0.05 vs. NT1 and NT3. Insert: representative light microscopy images of BAL cells after 1 day's exposure to 100 μg/mouse of NT1, NT2, or NT3 (magnification ×40). Abbreviations are the same as in Figure 1.

