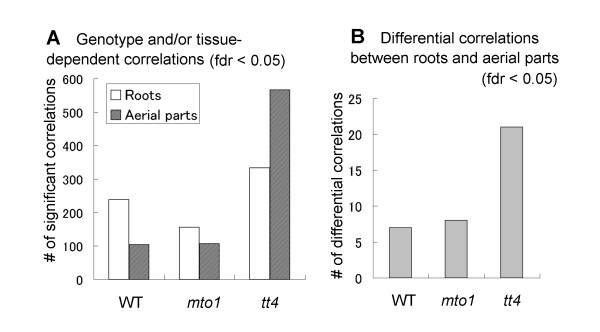
Figure 3.
Statistics of correlation analyses among the 3 Arabidopsis genotypes. (A) Genotype- and/or tissue-dependent correlations and (B) differential correlations between roots and aerial parts are shown. A significance level set at fdr < 0.05, local false discovery rate. fdr was calculated using fdrtool package [29]. The resulting correlations are all listed in Additional file 4.

