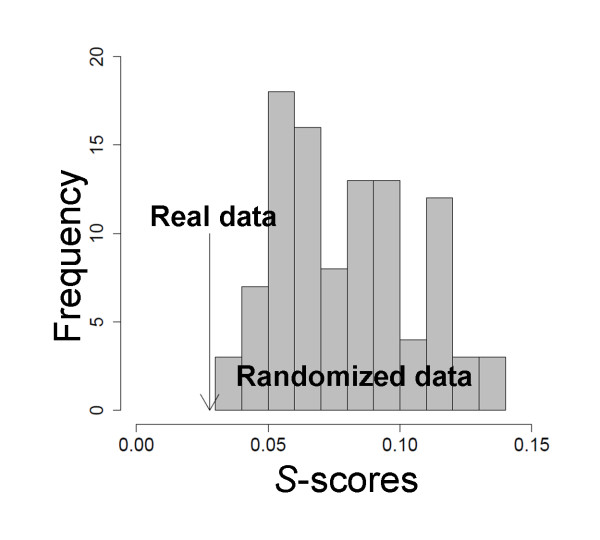
Figure 5.
Assessment of statistical significance in the resulting metabolomic clusters in mto1 roots using DPClus. The best p-values for the KEGG pathways, averaged over all clusters (S-score; see Methods), were compared with the corresponding values of 100 randomly generated clusters (grey histogram). The averaged S-score (black solid arrow) was 0.0278, indicating that real- scored significantly better than randomized data.

