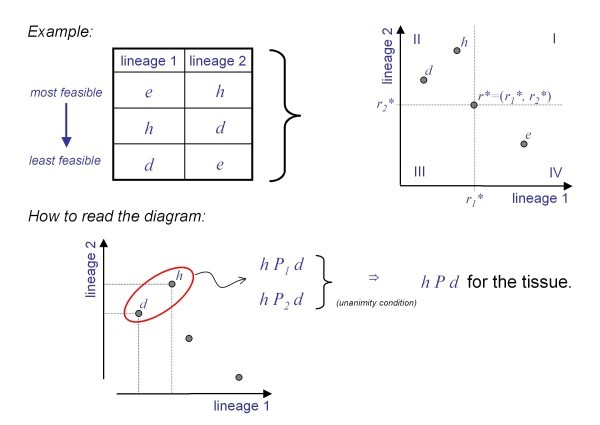
Figure 4.

Graphical proof of dominance. Without loss of generality, we consider two cell lineages at time t, with the propensity rankings shown in the table. For the graphical presentation we translate the orderings into the Euclidean plane. Only relative positions will matter and no actual numbers are required. The proof presented here is based on Blackorby et al. [29].
