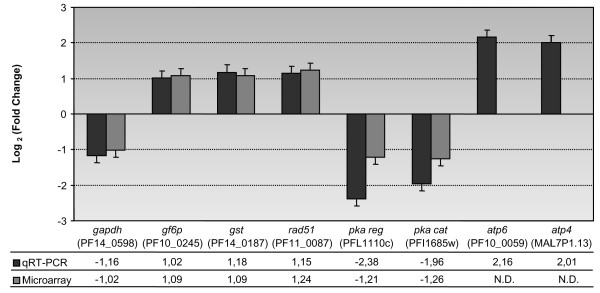
Figure 3.
Validation of microarray data by qRT-PCR. Data from qRT-PCR and a microarray of eight selected genes were compared between hyperoxic and normoxic conditions. Adjacent bars correspond to the mean log2 (fold change) and respective standard deviation and present qRT-PCR and microarray results in gray scale for the respective gene. The abbreviations and their corresponding gene IDs (PlasmoDB accession numbers) are indicated below the graphic. Crude values of mean fold changes are presented in the table. The same samples were used for the qRT-PCR and microarray experiments. gapdh: glyceraldehyde-3-phosphate dehydrogenase - gf6p: glutamine-fructose-6-phosphate transaminase - gst: glutathione S-transferase - pka: protein kinase A - atp6: mitochondrial ATP synthase F0 a subunit - atp4: mitochondrial ATP synthase F0 b subunit.

