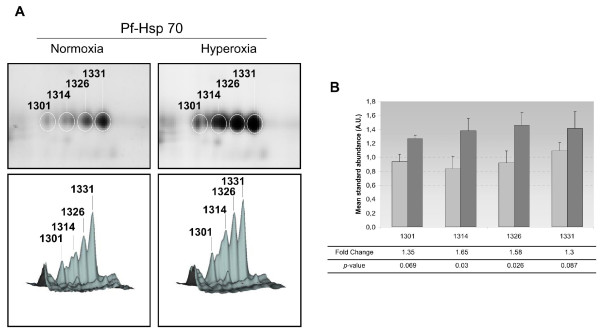
Figure 5.
Selective post-translational modification of Pf-Hsp70 following hyperoxia exposure. (A) Enlarged 2D-DIGE gel images and their corresponding three-dimensional profiles are shown for a series of four protein spots identified as Pf-Hsp70. The amount of protein is proportional to the volume peak. Numbers correspond to master gel and significant deregulated spots (i.e., 1314 and 1326) are reported in the table 2. (B) A graphic quantification of the four spots corresponding to Pf-Hsp 70 under normoxic (light-gray bars) and hyperoxic conditions (dark-gray bars). Spot numbers are specified at the bottom. Adjacent bars correspond to the mean standard abundance and respective standard deviation. Fold change and p-values are indicated at the bottom for each spot. A.U.: arbitrary units, FC: fold change.

