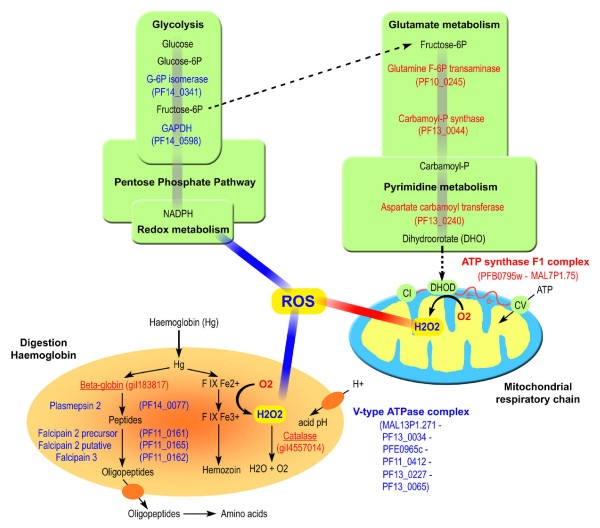
Figure 7.
A schematic representation of P. falciparum metabolic adaptation to hyperoxia exposure. Metabolic pathways based on the Ginsburg Pathway [72] for glycolysis (cytoplasmic), respiratory chain (mitochondria, blue and yellow) and haemoglobin digestion (digestive vacuolar, orange) are shown. The gene IDs (PlasmoDB) are reported for each enzymatic reaction. Human protein names are underlined. Up- and down-regulated genes and reactive oxygen species (ROS) production are indicated in red and blue characters, respectively.

