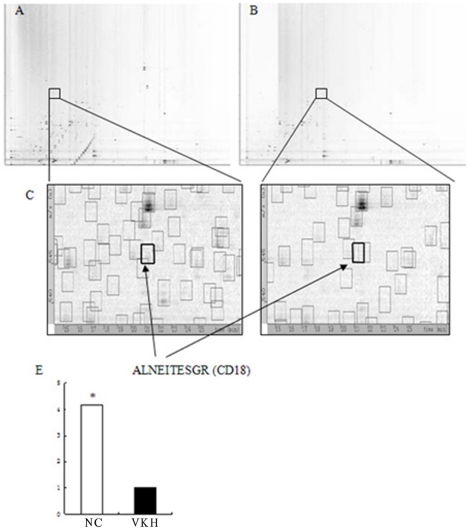
Figure 2. Decyder MS intensity graphs of CD18 derived from LC-MS/MS analysis of a total membrane protein extracted from both normal group (A) and VKH group (B).
The location of peptide ALNEITESGR in both samples was labeled with square frames in the total graphs and the magnified graphs (C and D). Statistical analysis showed that the different expression of peptide ALNEITESGR was significant between VKH group and normal group (E).

