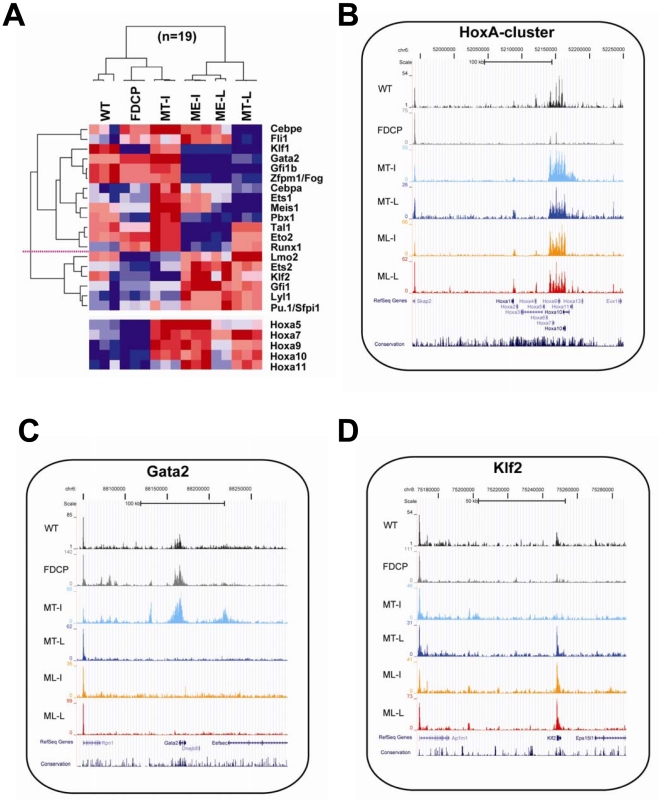
Figure 2. Dynamic changes of HSPC transcription factors during MLL-ENL and MOZ-TIF2 induced reprogramming.
A) Hierarchical clustering of 19 dynamically expressed HSPC transcription factors. For comparison, dynamic expression changes of 5 abdominal HoxA-cluster genes are depicted as a heatmap at the bottom of the figure but were not included for the clustering analysis. Clusters of repression and activation could be distinguished and are separated by a horizontal dotted red line. B) Dynamic changes of histone H3K9 acetylation (H3K9ac) at the HoxA-cluster gene-locus. ChIP-Seq traces are displayed on the UCSC genome browser for one representative biological replicate of the six conditions under investigation (WT, FDCP, MT-I, MT-L, ME-I, ME-L). C) Dynamic changes of H3K9ac at the Gata2 gene-locus. Down-regulation of Gata2 expression is paralleled by reduced acetylation marks. D) Dynamic changes of H3K9ac at the Klf2 gene-locus. Up-regulation of Klf2 expression is paralleled by increased acetylation marks.

