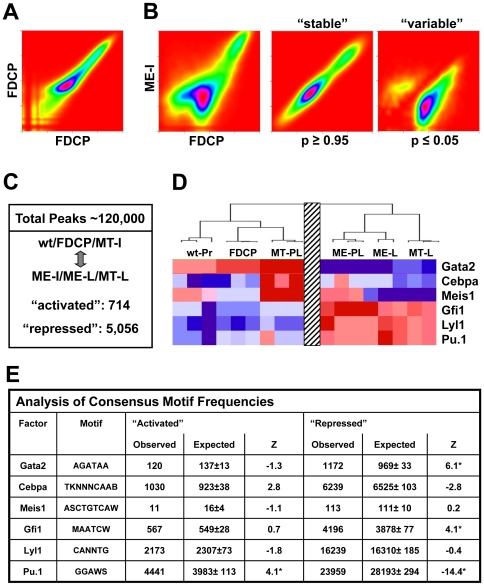
Figure 3. Over-representation of consensus binding motifs from differentially expressed HSPC transcription factors within most variable H3K9ac candidate regulatory regions.
A) Kernel Density Estimation Plots (heat-maps) of relative H3K9ac peak-scores from biological replicates used for analysis of leukaemogenic progression in MLL-ENL. Peak scores are depicted as colour-coded heat-maps for the two FDCP biological replicates. Most datapoints lie on a diagonal suggesting good correlation between biological replicates. B) Heat-maps of relative H3K9ac peak-scores for the FDCP/ME-I ‘Initiation’ comparison as well as depiction of “stable” and “variable” regions (T-test: p≤0.05). Variable regions were clearly divided into enriched (above 45° axis) and deprived (below 45° axis) regions. C) Summary of dynamically changing H3K9ac candidate regulatory regions for the wt/FDCP/MT-I v. ME-I/ME-L/MT-L comparison. D) Expression profile for selected HSPC TFs across the wt/FDCP/MT-I v. ME-I/ME-L/MT-L comparison (derived from Fig. 2A). E) Observed and expected frequencies of 6 consensus-motifs in most variable H3K9ac candidate regulatory regions from C). Significantly increased and reduced peak-regions were used for the detection of differentially distributed motifs using bootstrap analysis with 1000 sets of background sequences (see methods). Significant under/over-representation was defined by a Z-score of ≤−3 or ≥+3 (indicated by a *).

