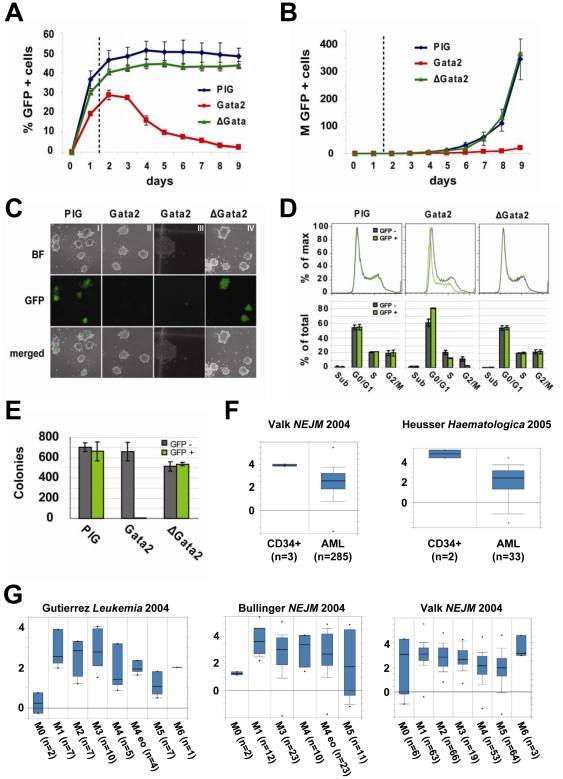
Figure 4. Gata2 over-expression interferes with cell-cycling and is incompatible with sustained proliferation of MLL-ENL transduced cells.
A) Fraction of GFP-positive cells monitored in a competitive proliferation assay performed in liquid culture over a time-course of 9 days. ME-I cells were transduced with pMSCV-Pgk-Puro-IRES-GFP (PIG), pMSCV-Gata2-Pgk-Puro-IRES-GFP (Gata2) and pMSCV-ΔGata2-Pgk-Puro-IRES-GFP (ΔGata2). Vector constructs are outlined in Figure S9A and B in Supporting Information S1. X-axis depicts days after transduction, y-axis the GFP-positive cell-fraction (% of total viable cells). GFP-positive and GFP-negative cells of each sample were analysed together without prior FACS-sorting. Results from two independent experiments (mean ± SD) are shown. Subsequent analysis (Figure 4D) was performed 36 hours after transduction (indicated by the dotted line). B) Growth curves show that Gata2 overexpression is incompatible with sustained proliferation of ME-I cells. X-axis depicts days after transduction, y-axis the total GFP-positive cell-number (in millions) determined from the GFP-positive fraction and the total number of viable cells. Results from two independent experiments (mean ± SD) are shown. C) Representative pictures of colony-formation in a competitive proliferation assay performed in semi-solid culture. ME-I cells were transduced with PIG, Gata2 and ΔGata2 and 104 cells transferred to methylcellulose after 36 hours. Images were taken after 4 days under bright-field (BF) and with GFP fluorescent light (GFP) and merged with 10x magnifications (except section III, which was taken at 20x magnification). D) Cell-cycle analysis of GFP-positive and GFP-negative cells 36 hours after transduction. The upper panel depicts a representative cell-cycle plot of GFP-positive and GFP-negative ME-I cells after transduction with PIG, Gata2 and ΔGata2. Note that GFP-positive and GFP-negative cells of each sample were analysed together without prior FACS-sorting, providing an internal control for gating and settings of the instrument. X-axis shows PI fluorescence intensities, y-axis % of maximal counts. The lower panel depicts % of total counts in sub-G0/G1 (sub), G0/G1, S and G2/M-phase as determined by the cell-cycle plot for GFP-positive and GFP-negative cells. Results from two independent experiments (mean ± SD) demonstrated statistically significant alterations for the Gata2 transduced cells (sub, p = 0.97; G0/G1, p = 0.033; S, p = 0.068; G2M, p = 0.041; two-tailed t-test). E) Bar-chart of numbers of GFP-positive and GFP-negative colonies from C). Results from two independent experiments (mean ± SD) are shown. F) Comparison of GATA2 expression from published human AML microarray datasets performed with Oncomine (http://www.oncomine.org) [62]. Boxes display median expression values and contain data from the 25th to 75th percentiles with the bars representing the 10th and 90th percentiles respectively. Y-axis show log2 median centered ratios. The Valk et al dataset (GEO accession number: GSE1159) [31] shown on the left shows relatively high GATA2 expression in CD34+ control cells when compared with bone marrow samples from 285 AML-patients (probe H00625, note that 10th percentile of the CD34 samples is higher than the 90th percentile of the AML samples, thus indicating a significant difference in expression levels). The Heuser et al dataset (GEO accession number: GSE4137) [32] on the right similarly shows significantly higher levels of GATA2 in CD34+ cells from two healthy controls compared to blood and bone marrow samples from 33 AML-patients prior induction chemotherapy. G) Oncomine analysis of three independent gene expression datasets (GEO accession numbers: GSE1729, GSE425, GSE1159) [31], [33], [34] demonstrates that GATA2 expression levels are not higher in AML subtypes characterised by minimal differentiation (FAB AML-M0).

