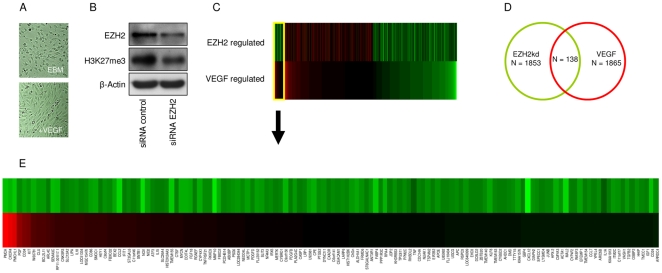
Figure 4. mRNA profiling of VEGF and EZH2 modulated endothelial cells.
(A) Primary human brain microvascular endothelial cells (HBMVECs) were cultured in the absence (top) or presence (bottom) of VEGF. (B) Western blot analysis of EZH2 and H3K27me3 expression in HBMVECs upon silencing of EZH2 by EZH2 siRNA. (C) Heatmap representation of top 5% percentile genes up-regulated by EZH2 knock down or down-regulated by VEGF stimulus, the overlapping section of genes regulated by both EZH2 knock down and VEGF stimulus is shown on the left. The top bar represents Log2 fold change ratios of EZH2kd (all >0), the bottom bar represents Log2 fold change ratios of VEGF stimulus (all<0). (D) Venn diagram showing a significant overlap of EZH2 regulated and VEGF regulated genes. Top 5% percentile genes up-regulated by EZH2 knock down or top 5% percentile genes down-regulated by VEGF stimulus were considered potential targets. (E) Detail of heatmap, showing the cluster of genes that are regulated by both EZH2 knock down and VEGF stimulus.

